One tool for your building and workspace metrics
Easy to use analytics that allows you to get insights on how your officespace or building is being used!
.png?width=2000&height=1411&name=Untitled%20design%20(73).png)
See how your spaces is being used!
Building utilization
See which buildings are most popular and which floors are most used. Now you get full insight into space utilization.
Meeting Room and Desk Utilization
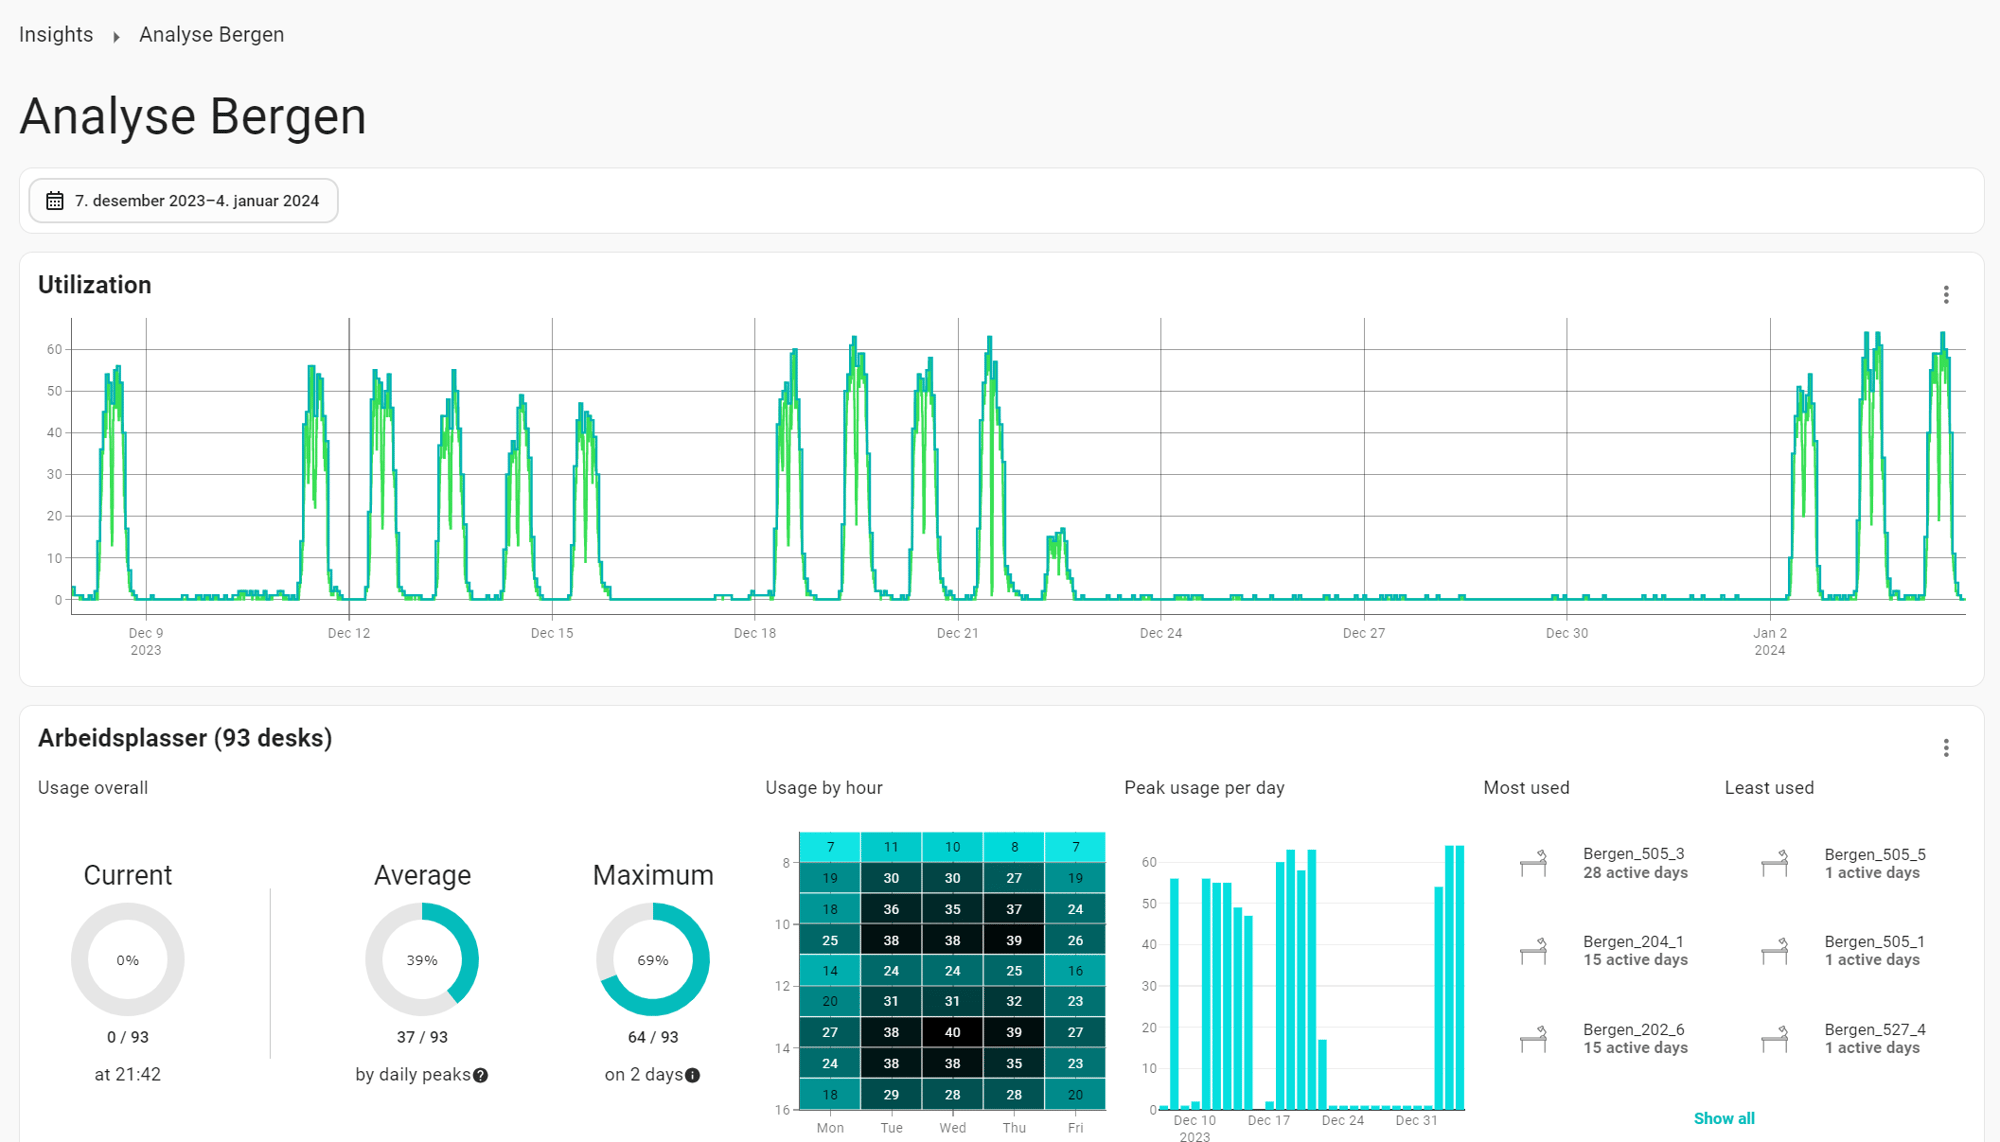
What types of rooms are most popular? How much are your office desks being used? Do you need more or fewer? No worries, we’ve got you covered with the right data.
Heatmaps
See live data or go back in time to get a heatmap of which areas are most popular so that you can optimize your office space.
People Counting
By using people counting sensors, CCTV, or even UC equipment, we provide you with full insights on people counting and flow.
Air Quality
Integrate your new or existing sensors with the Neowit Platform and get data on air quality—both live and historical!
Booking Insights
How do people book rooms and desks? How many ghost bookings do you have? What days are most popular? And much more!
Desk Utilization
How much are your office desks being used? Do you need more or fewer? No worries, we’ve got you covered with the right data!
Data Cross-Check
Cross-check data against each other. How are people and air quality affecting a room, floor, or the building in total?
Integrate with your existing technologies

